Oceans, Not Air, Drove 84% of Polar Ice Loss Since 1979
A 45-year satellite record puts combined Greenland and Antarctic losses at 11.3 trillion tonnes, and shows the 2020 to 2023 slowdown came from snowfall and mild summers while ocean-driven discharge kept rising.
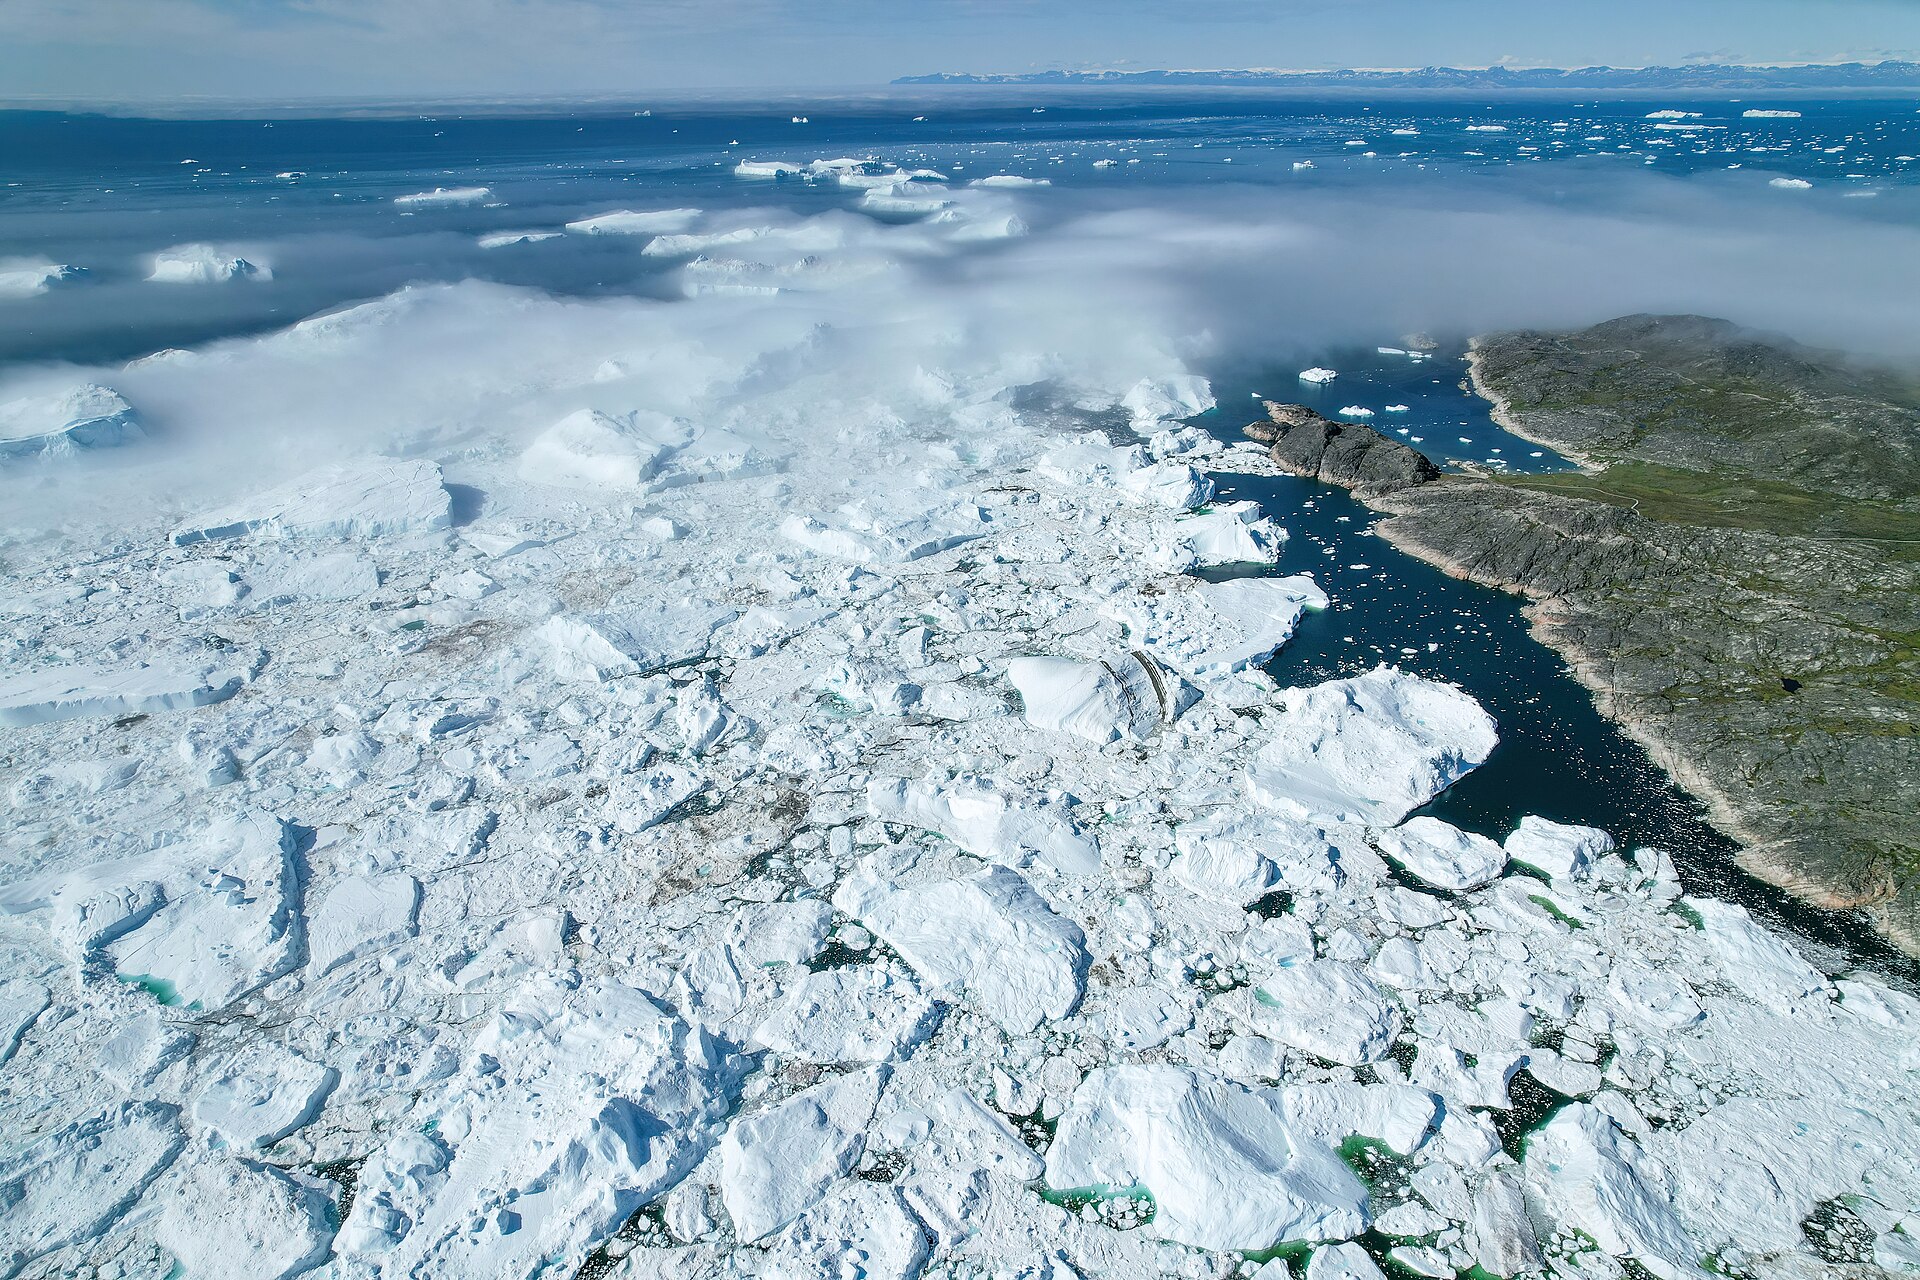
Greenland and Antarctica lost 11,309 billion tonnes of ice between 1979 and 2023, enough to raise global sea level by 31.4 millimetres, according to a dataset from the Ice Sheet Mass Balance Inter-comparison Exercise (IMBIE) published in Scientific Data on 16 September 2026. The same paper attributes 84% of that loss to glaciers speeding up and discharging ice into the ocean. Only 16% came from melting at the surface.
The team combined 45 independent surveys from 27 satellites, the Associated Press reported on 16 September, extending the record back to 1972 for Greenland and 1979 for Antarctica by adding NASA data to the European series that previously began in the 1990s. The split between discharge and surface melt is the result that matters most. Surface melt rises and falls with the weather of a given summer. Discharge is driven largely by warmer ocean water eroding glaciers from below and at their fronts, and the record shows it has not eased.
Greenland’s step change after 2000
Greenland was close to balance in the 1970s, the paper says. It then lost 60 billion tonnes a year in the 1980s and 57 billion tonnes a year in the 1990s before losses tripled to 192 billion tonnes a year in the 2000s and reached 264 billion tonnes a year in the 2010s. The 2010s were the first decade in which Greenland lost more ice to reduced surface mass balance than to ice dynamics. Across 1972 to 2023 Greenland lost 6,215 billion tonnes, 67% of it through increased discharge.
Greenland’s annual ice loss by decade. Greenland Ice Sheet: 1980s 60Gt/yr, 1990s 57Gt/yr, 2000s 192Gt/yr, 2010s 264Gt/yr.
Greenland contributed 1.81 centimetres of the sea-level rise and Antarctica 1.33 centimetres, the European Space Agency said in its summary of the study on 16 September. Lead author Inès Otosaka of Northumbria University told the AP that every centimetre of sea-level rise exposes another 2 to 3 million people to flooding at least once a year, and that Jakobshavn glacier in western Greenland is now retreating up to 50 metres a day.
West Antarctica keeps accelerating
Antarctica’s annual losses rose from about 48 billion tonnes in the 1980s to 202 billion tonnes in the 2010s, ESA said, and all of the continent’s net loss came from ice dynamics. The paper shows West Antarctic ice discharge rising in every decade of the record, from 29 billion tonnes a year in the 1980s to 163 billion tonnes a year in the 2010s, with Pine Island and Thwaites glaciers doing most of the work. East Antarctica, by contrast, has been roughly in balance over 45 years, with a trend of 1 billion tonnes a year, plus or minus 9.
There is a clear trend that the ice sheets are losing more mass and it has been increasing from decade to decade, especially if you look at the ice being discharged to the ocean
A pause made of snow
From 2020 to 2023 the totals eased. Record snowfall in East Antarctica in 2022 and 2023 produced a net gain of 92 billion tonnes a year there, plus or minus 63, which offset West Antarctic losses even as discharge in the west rose a further 38%. Antarctica’s rate of loss over those four years was more than three times smaller than in the 2010s, the paper says. In Greenland, a run of milder summers halved surface-melt losses while dynamic losses continued at a similar pace.
The honest reading is that the slowdown came from the variables that matter least over decades. Snowfall and cool summers moved the four-year totals; the ocean-driven discharge responsible for 84% of the 45-year loss kept going or sped up. Otosaka told the AP that the published record stops in 2023 but that measurements she has examined since show the accelerating trend has resumed. That later data has not yet been through peer review, and nobody yet knows how long the heavier East Antarctic snowfall will last or how far it can offset losses in the west.
What happens next?
- Otosaka says data since 2023 show acceleration resuming; that finding will need to be confirmed in the next peer-reviewed IMBIE assessment.
- Researchers will watch whether record East Antarctic snowfall persists or fades, which will decide how much of the West Antarctic loss it continues to mask.
- Coastal planners can now draw on a single reconciled record reaching back to 1972 for Greenland and 1979 for Antarctica.
Sources & references
- 01Mass balance of the Greenland and Antarctic ice sheets from the 1970s to 2023 — Scientific Data (Nature Portfolio)researchIMBIE team, published 16 September 2026; totals, decadal rates and 2020 to 2023 changes
- 02Faster-flowing glaciers fuel decades of polar ice loss — European Space Agencyprimary16 September 2026; Antarctic decadal rates and sea-level split
- 03Earth lost more than 12 trillion tons of ice from Greenland and Antarctica in 47 years, satellites show — Associated Press (via PBS News)newsSeth Borenstein, 16 September 2026; survey count and author interviews
More from Climate
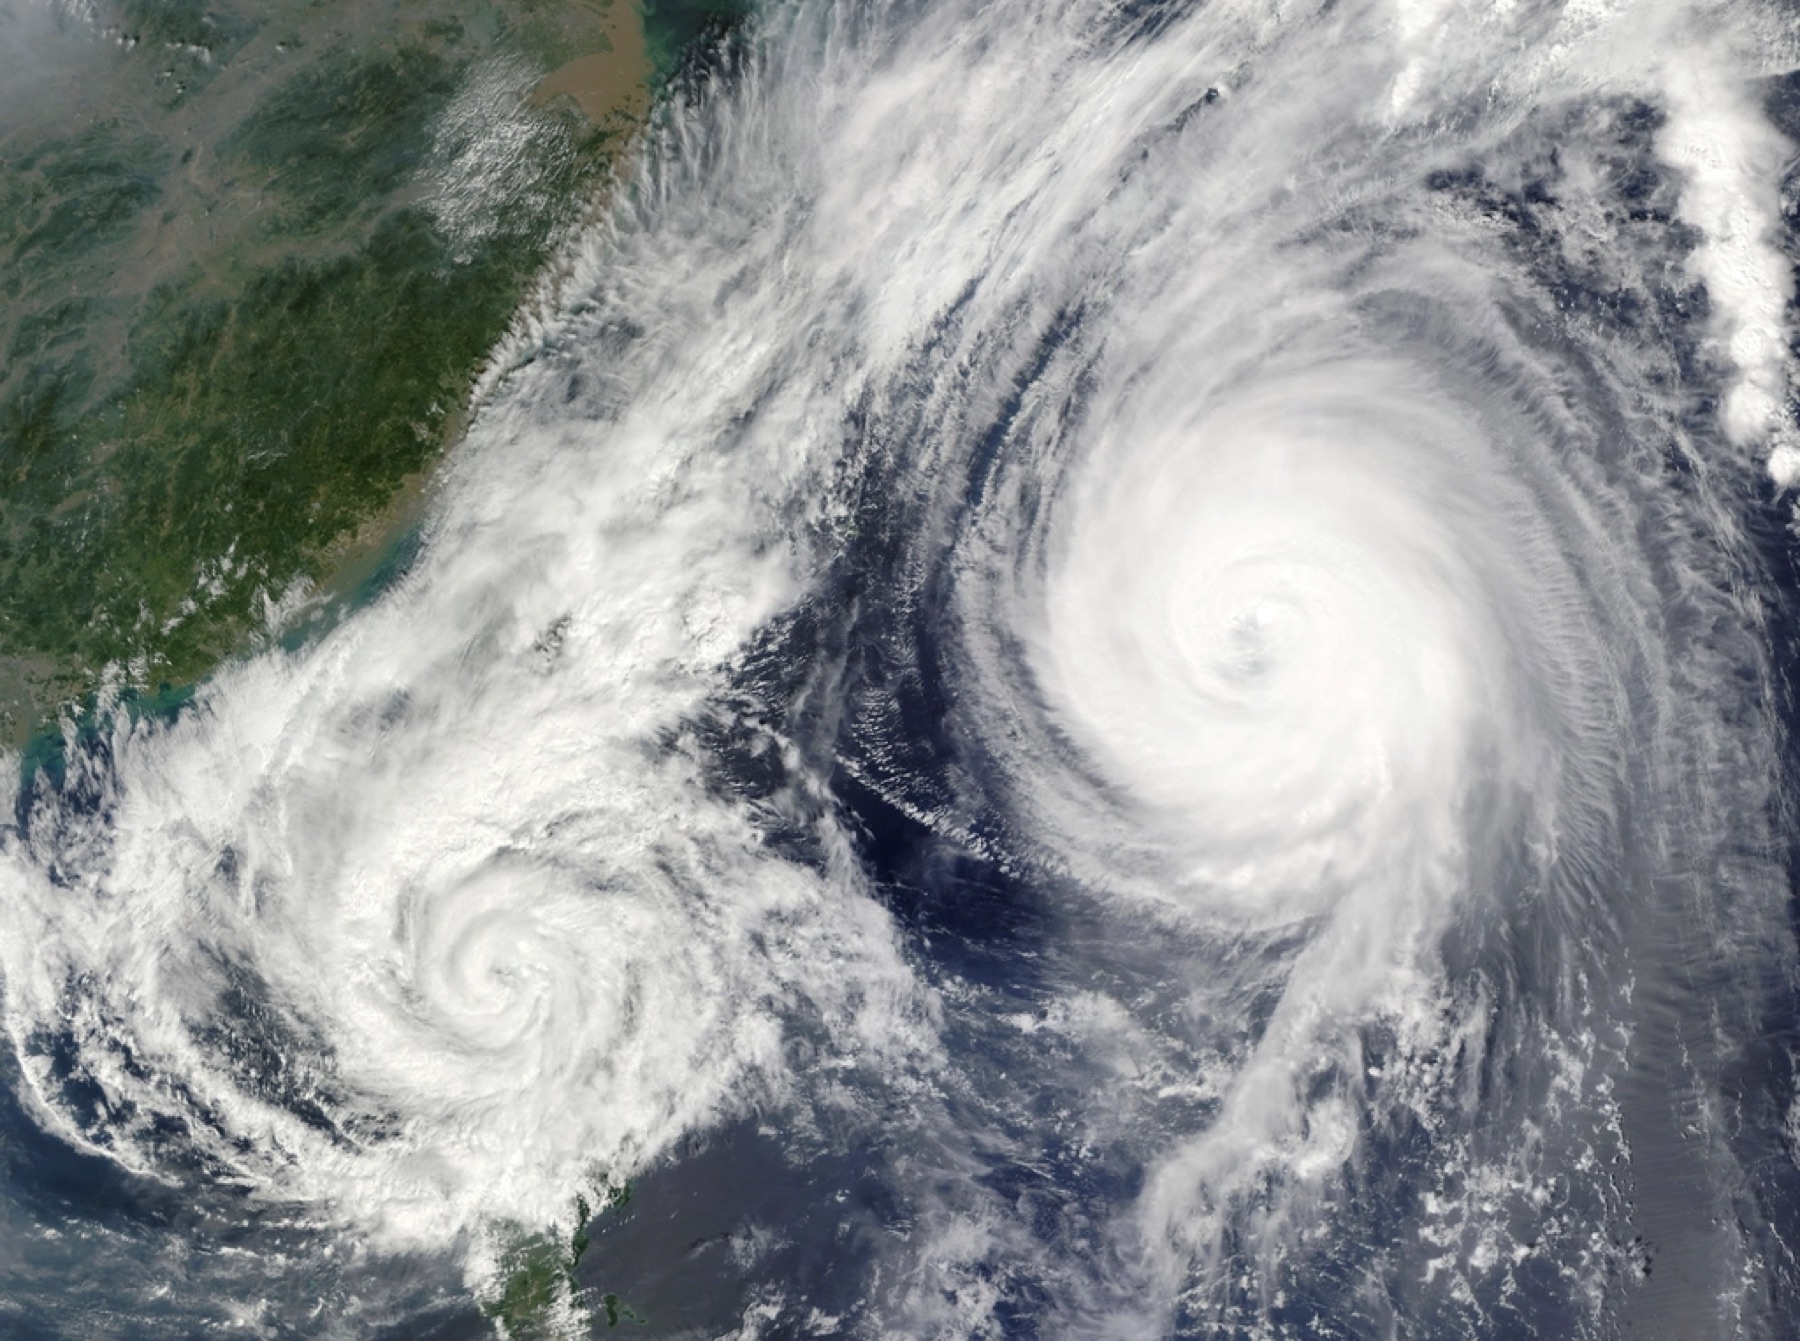
The Weather Forecast Is Now an AI Model
Released on 3 September 2026, WeatherNext 3 learns from live geostationary satellite feeds and station observations rather than physics-model output, forecasts at 5 km resolution hourly, and leads Brightband's Operational WeatherBench. Its new wind and solar variables target grid operators and renewables developers.
Google Buys Power Before It Builds Data Centres
Fervo Energy's 396 MW geothermal PPA with Google (1 September) and Google's 22-year deal for up to 50% of Fortum's Loviisa nuclear output (9 September) show hyperscalers paying to keep or build clean-firm capacity, with deals now deciding whether existing plants survive past 2030.